...
Sometimes these location-specific patterns become clearer when you look at the whole tree across all tasks. Most tools provide a matrix view of your results, where the tree is down the left side, and the tasks are across the top. Each cell shows the number of participants who chose that answer for that task, color-coded as right or wrong. Here’s an example from Treejack’s Destination view:
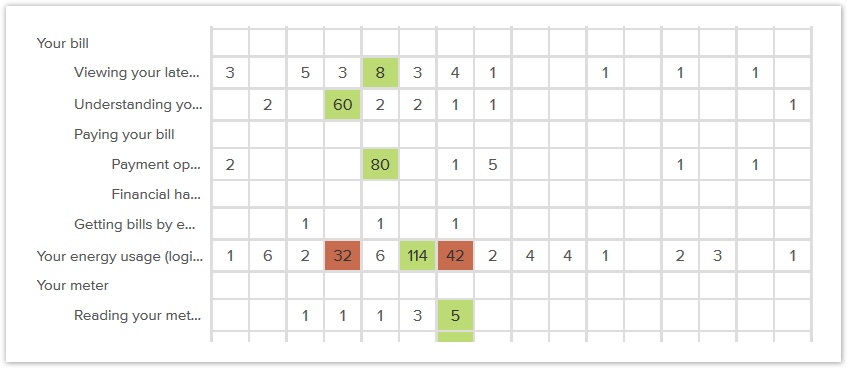

As we scroll down through the tree, we can see clusters of answers.
If a section of the tree is performing well, we’ll often see clusters of correct answers (shown here in green):
- pic of cluster of correct answers
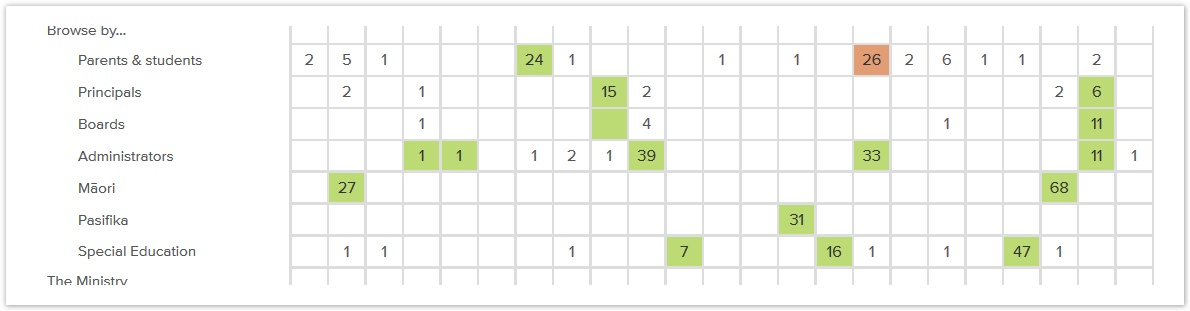
. For example, it appears that the Browse by section is working for participants:
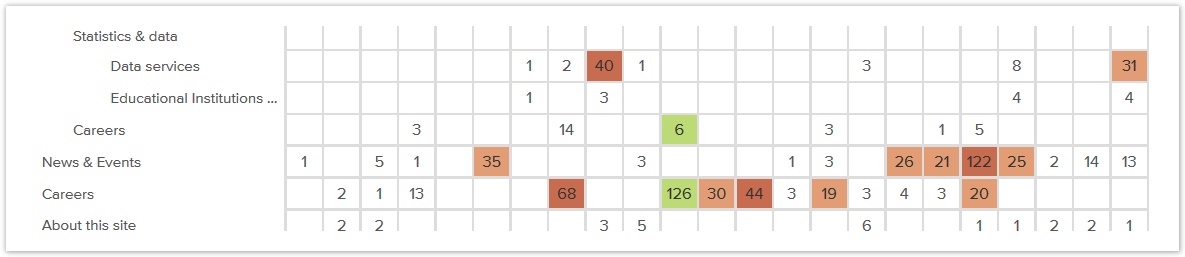
If, however, we see clusters of wrong answers in a section, it suggests that participants are having trouble with topics in that section, and you need to look more closely at those tasks to see if there’s a common factor you can identify (and fix). Below, it's clear that the News & Events and Careers sections are attracting far too many unwanted clicks:
...
...
Next: Analyzing by user group or other criteria
...