...
Suppose, for example, that we were looking at the results for a single tree test of the Shimano website. In Which part of the tree? in Chapter 6, we saw that Shimano has 3 major types of users – cyclists, anglers, and rowers. And suppose that the cyclists and anglers had no problem with tasks that covered the Corporate section of the site, but rowers failed miserably at those. If you looked at the results of all users together, the high scores of the cyclists and anglers would get mixed in with the low scores of the rowers, and you would just see a mediocre middling composite score, with no easy way to find out what caused it.
...
- Narrow the results to a single user group by filtering the data to only include participants who chose that user group in the “who are you” survey question.
- Regenerate the results (if this is not done automatically).
Here’s an example using Treejack:
- TJ example of selecting participants based on user-group survey question, then regenerating results
...
Once you’ve where we want to see if there are differences between members, prospective members, and the general public.
To get the results for prospective members, we filter our data set using a "who are you" survey question:
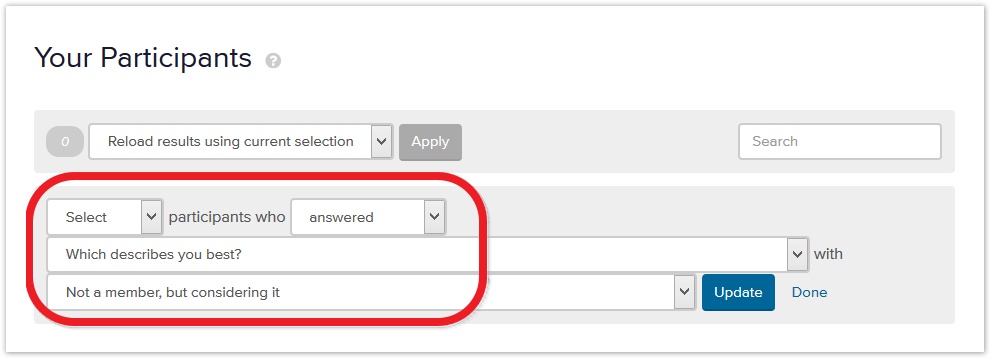
That selects 26 participants. We now we regenerate the results based on that subset of prospective members:
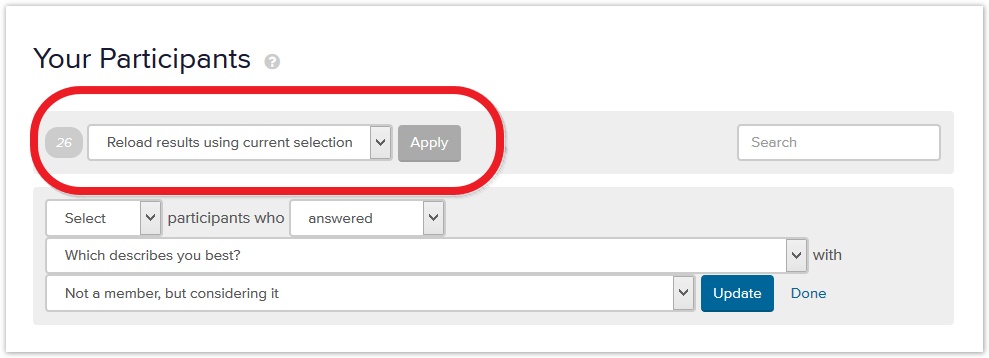
Once we’ve generated the results for each group, analysis proceeds as we’ve described elsewhere in this chapter. But at each step of the analysis (success rates, backtracking, first clicks, etc.), we can compare how the groups performed and look for any major discrepancies between them.
...