...
This method really comes into its own when we compare several trees that we tested with the same (or very similar) tasks:
| View file | ||||
|---|---|---|---|---|
|
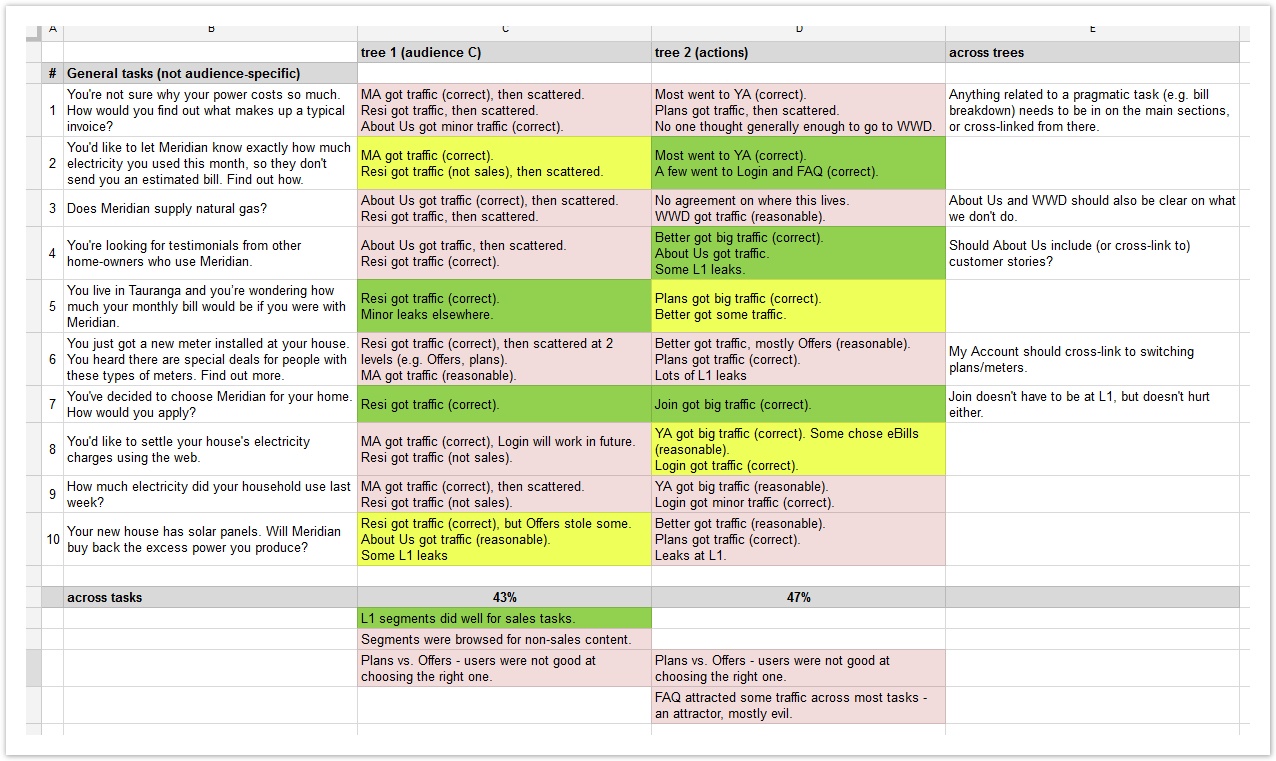
- We added a column for the findings of each tree.
- We added a summary column on the right.
For each row (i.e. for each task), this lets us adding common findings across all trees. - We add summary rows at the bottom.
For each column (i.e. for each tree), we can add common findings across all tasks for that tree.
This gives us a matrix of trees vs. tasks, where all of our findings are in a single place, making it easier to see the bigger patterns. It’s also a compact way of coming back to our findings later.
Here's a sample Excel spreadsheet of findings, using the method shown above:
| View file | ||||
|---|---|---|---|---|
|
Note that we’ve used a spreadsheet here, but we’ve also done this matrix using a whiteboard, adding each finding as a color-coded sticky note (where green is good, pink is bad, and yellow is neutral).
...