...
For example, if we're researching how cyclists buy bike gear online, we might observe 20 people and discover the following:
| Content | Most are looking for parts and accessories, not bikes (perhaps because they prefer examining and trying bikes in person at a store). |
|---|---|
Grouping | Non-experts preferred items to be grouped by topic (e.g. parts, clothing, etc.), not by brand. |
| Terms | Most understood Parts vs. Accessories, but did not know the difference between one-speed and fixed-gear bikes. |
| Browsing/searching | They all started by browsing the menus unless they already knew the exact model name/number to search for. |
...
Here's an example from the New Zealand Film Commission, where we asked filmmakers to sort typical content from the Film Commission's website:
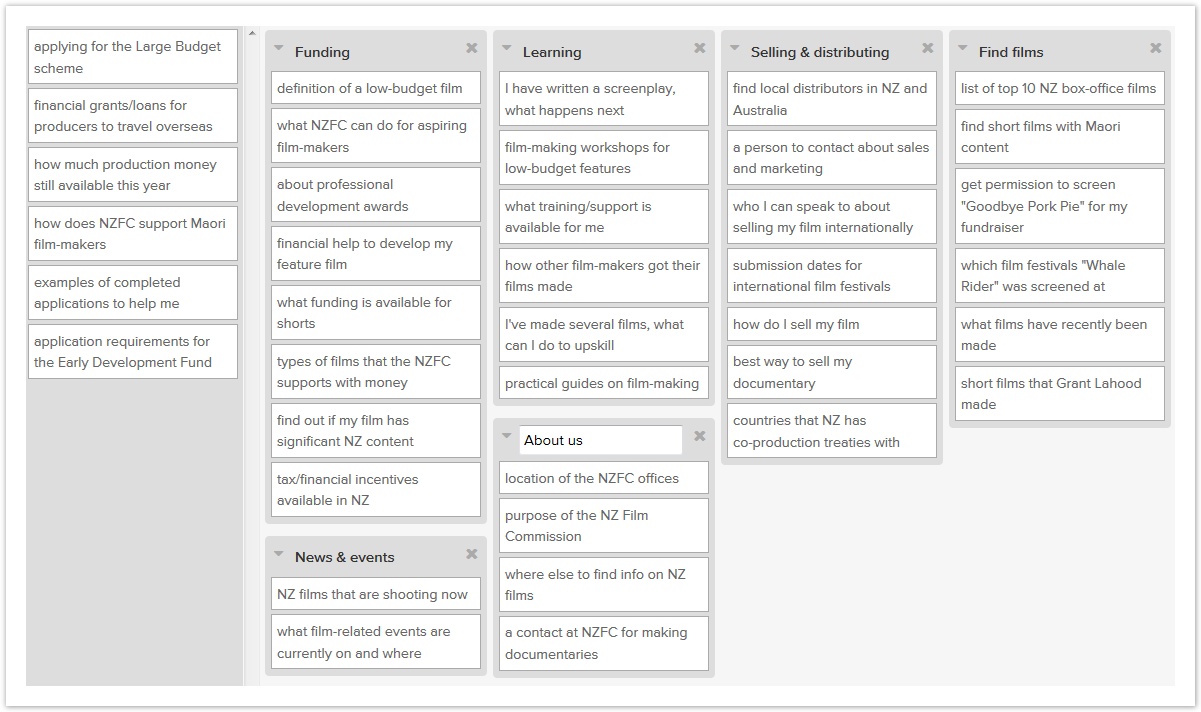
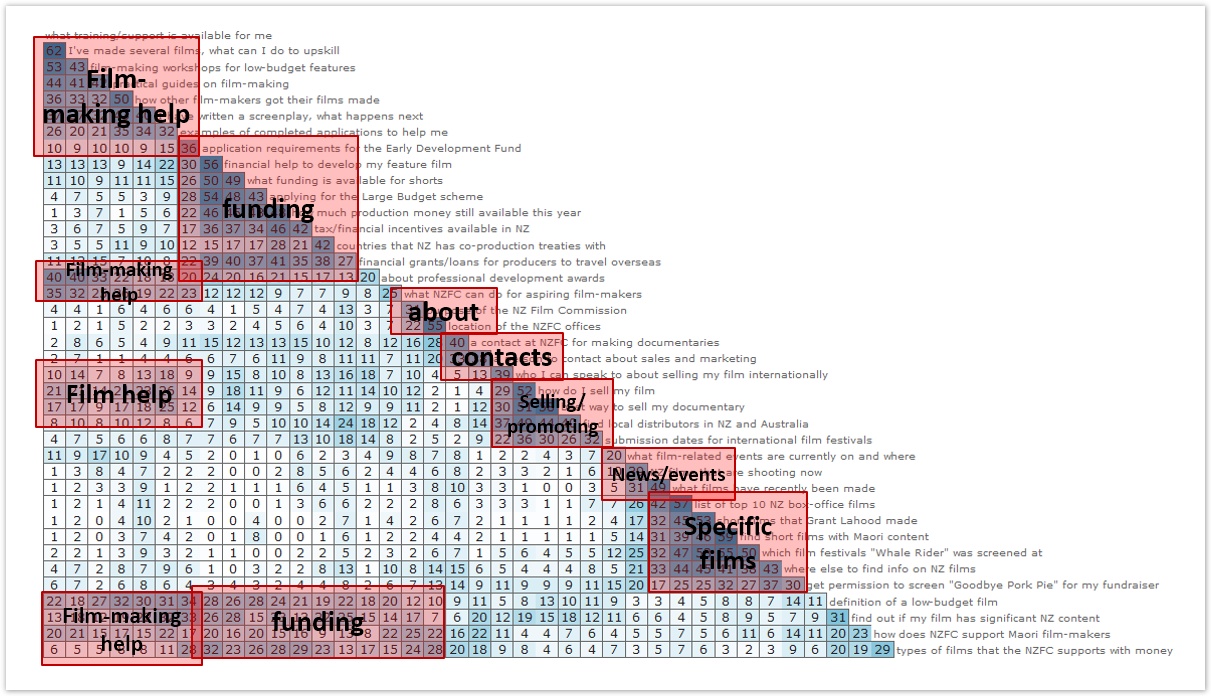
We then analyze the data to see if there are patterns in how the participants grouped the items, and what they called those groups.
The findings from a card sort can fundamentally change how we structure our site. For example, suppose we are designing a recipe website.
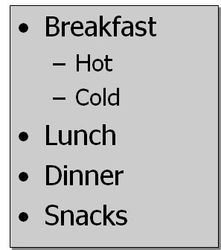
- We might have initially thought about grouping the recipes by time of day:
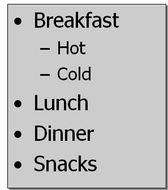
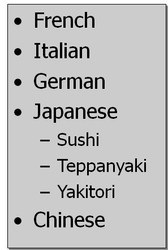
- If the card sort revealed that most of our participants grouped the recipes by cuisine, we should really reconsider our main headings:
...
For example, one of the first organizations to use tree testing was ACC, a public-health service in New Zealand. When they redesigned their website a few years ago, they did a baseline test before they revised their site tree. Here's what they found:
| Tree | Overall score |
|---|---|
| Existing site | 30% |
| Revised site | 67% |
...