...
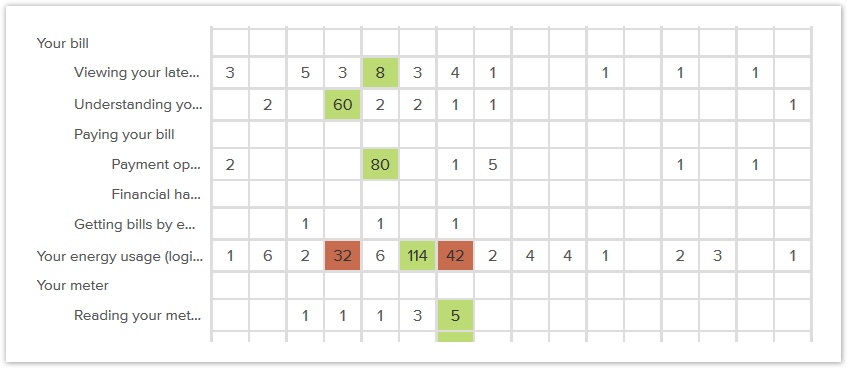
Sometimes these location-specific patterns become clearer when you look at the whole tree across all tasks. Most tools provide a matrix view of your results, where the tree is down the left side, and the tasks are across the top. Each cell then represents a possible answer (shows the number of participants who chose that answer for that task, color-coded as right or wrong). Here’s an example from Treejack’s “Destination” spreadsheet Destination view:
...
As we scroll down through the tree, we can see clusters of answers.
...
