...
If you have a previous tree test to compare with, the answer is easy–at least if the trees and tasks cover the same functionality. (No fair comparing between tests with different tasks or different content.) The score is "good" if it's better than the last time you tested. This is one of the advantages of a tree test actually; it's relatively easy to benchmark your current information architecture structure against alternatives, and to iterate quickly. So if you hadn't planned on setting a baseline, maybe reconsider; it's much easier to make a case for change if you can show improvement.
If you don't have a previous test to compare against, you're back to wondering if it's good, bad, or average. And as any consultant will tell you, the answer is: it depends. Mainly, it depends on two things:
...
- 0-50 – The tree needs to be completely rethought or discarded.
Trying to tweak it will only bring it up to “mediocre”. - 50-65 – The tree needs substantial revisions.
If our analysis reveals specific problems (and it should), and we think we can fix them, we should be able to revise this tree to perform well. - 65+-80 - The tree is effective, but may need minor revisions.
Our participants are finding the correct answer at least two-thirds of the time, so the tree is doing its job well, and only needs tweaking. - 80+ - Either the tree is very good, or the tasks are too easy.
We don't see many well-constructed tree tests with scores over 80. It does happen, but we really should review our tasks to make sure they're not too easy, and that we're not giving away answers by word matching.
| Warning |
|---|
| A high score doesn’t mean “no revisions needed”. We’ve never run a tree test where everything worked so well that we couldn’t improve it a bit more. There are always a few lower-scoring tasks that suggest further improvements. |
What the overall success rate doesn't tell us is how much the success rate of the individual tasks varied. For example, a 60% overall score may mean that all tasks hovered around 60%, or that half our tasks were 90% and half were 30%. To find out, we need a breakdown by task, which some tools summarize in a graph like this:
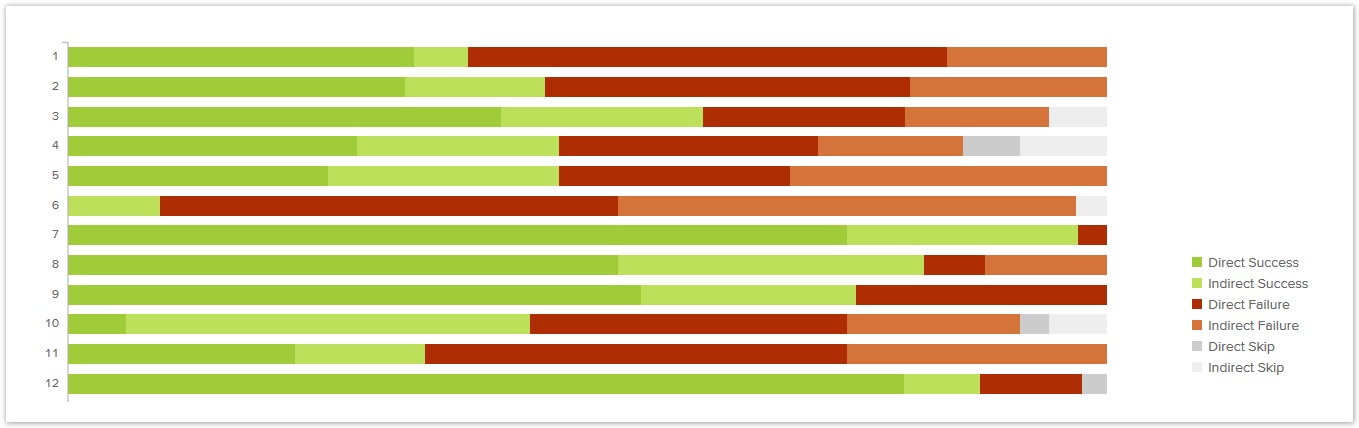
In this example, we can see that a few tasks had very low success rates, and two were very high. To find out more, we need to drill down to the task level - see Task success rate later in this chapter.
Comparing tree-test scores to usability-test scores
People are often surprised that we consider 65+ to be a "good" score. Shouldn't we set the bar at 80 or 90?
Effective trees don't usually score higher than 80 because we're testing a top-down text-only tree with no other aids. Our participants are making choices without the benefit of:
- other navigation aids such as see-also links, featured links, and multi-level browsing (e.g. mega menus)
- visual design - chunking of links/content, and emphasis on more important links/content
- content that explains headings using decoration text, hover text, etc.
Once we refine our text tree to be effective (i.e. perform well in tree testing), we should then be able to add these other design elements to further improve the findability of items in our website.
| Info |
|---|
| In our experience, success rates from the final website tend to be 20-30% ~20% higher than the scores we see in tree testing. |
Lisa Fast at Neo Insight has written an interesting article comparing tree-test scores to usability-test scores. Here's the graph of how they related in her study:

Lisa found that not only were the two scores correlated, the usability-test scores were 29% higher (on average) than the tree-test scores.
Finally, we should warn that adding other aids is no guarantee of improvement. A poor visual design, clumsy navigation, and confused or sub-par content can actually make a website perform worse in usability testing than it did in tree testing. A single method can only go so far. ![]()
Overall directness (backtracking)
...
- Treejack calculates its overall score as a weighted average of success rate and directness (at a 3:1 ratio), but does not include speed in its calculations. ~no longer provides a total score?
- UserZoomother tools?
...
Next: Analyzing by task