...
When it comes to taking notes, everyone seems to work out their own favorite method over time. Some take longhand notes in a journal, some prefer to red-pen hard-copy output, and so on. Below, we describe some methods that have worked well for us in past studies. Feel free to mix and adapt them as you see fitneeded.
What makes an effective "finding"?
...
Here are some examples of effective findings, to give us an idea of what we should be aiming for:
"
...
Although the Meetings section attracted traffic for the right tasks, once there, many users backtracked (presumably because the Calendar subtopic wasn't specific enough)."
"The Our Work section was too general (attracting clicks on almost every task) and also too vague (not attracting traffic for some of its subtopics)."
"The audience-based sections (Special Education, Maori, and Pasifika) performed well overall, attracting traffic only when relevant to the task."
"The Boards/Principals section and the Admin section were continually confused by participants."
Marking up the hardcopy
The most obvious way to record findings is to print the results of each task and mark them up with a red pen, circling items of interest and jotting down findings (and follow-up questions) beside them:
- ss of each tool’s task output with typical markups
. This method is simple and direct, and can be cleaned up for a slide presentation later.
However, because the findings are scattered across disparate tasks, it’s a bit harder to pull together the big picture – that is, patterns that recur across tasks or across several trees. We So, we recommend that you:
- Do Doing a first pass on a given tree, examining each task separately.
- Do Doing a second pass on that tree to look for insights across tasks, and record these on a separate sheet.
- If you’re we’re testing several trees, do doing a third pass to look for similarities and differences across all the trees.
...
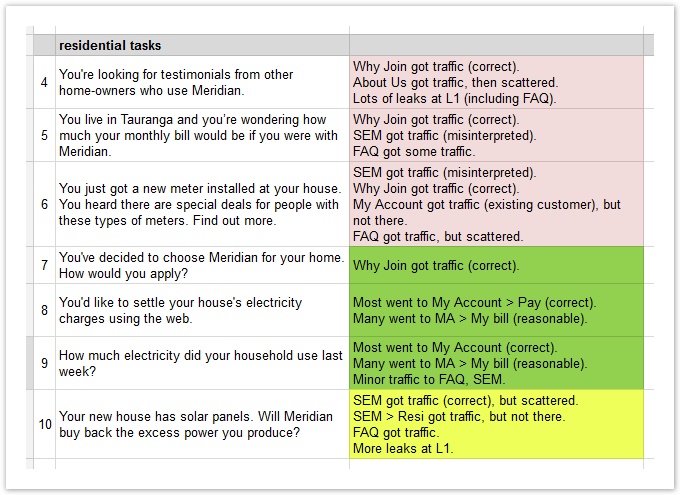
Another way to recording findings is to list the tasks down a column of a spreadsheet, then list your our findings beside each task:
- ss of tasks from single tree
. (The example below also uses color coding to indicate the task's success rate.)
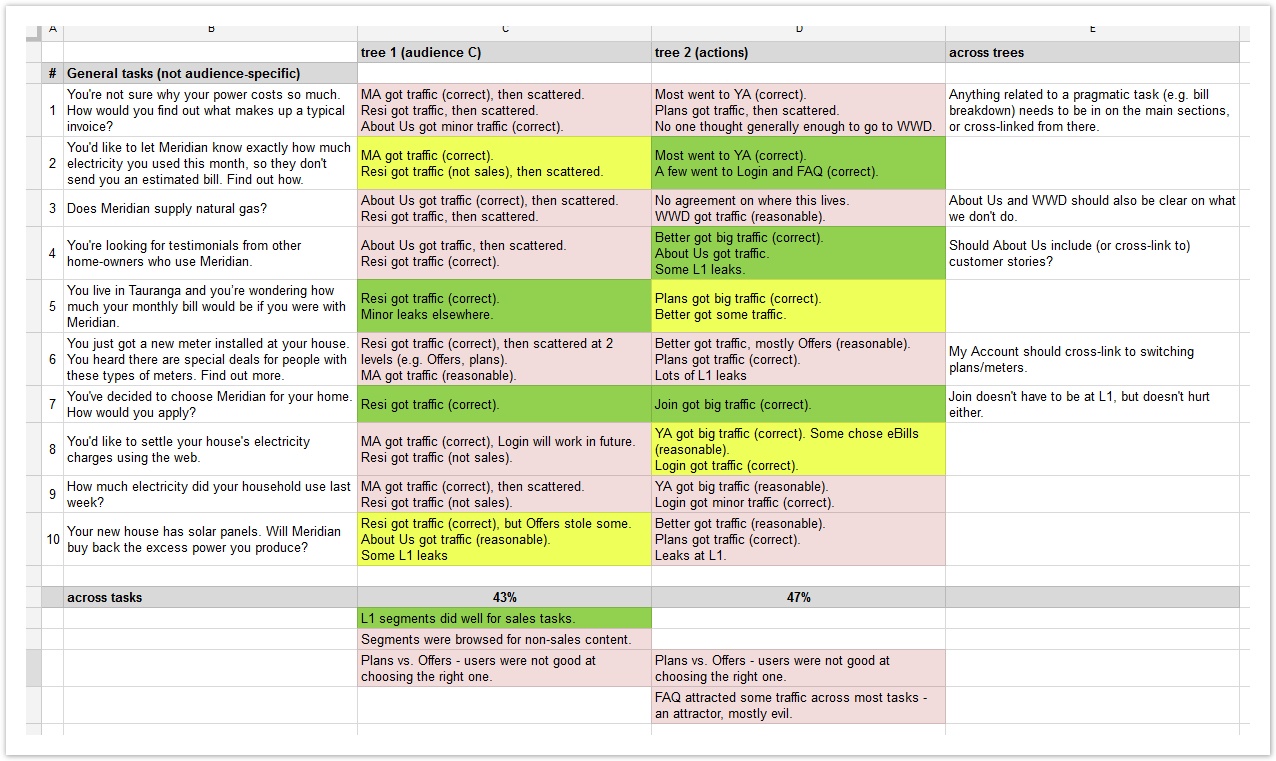
This method really comes into its own when we compare several trees that we tested with the same (or very similar) tasks:
| View file | ||||
|---|---|---|---|---|
|
- We add added a column for the findings of each tree.
~ss - We add added a summary column on the right.
For each row (i.e. for each task), this lets us adding common findings across all trees.
~ss - We add summary rows at the bottom.
For each column (i.e. for each tree), we can add common findings across all tasks for that tree.
~ss
This gives us a matrix of trees vs. tasks, where all of our findings are in a single place, making it easier to see the bigger patterns. It’s also a compact way of coming back to our findings later:
- ss
.
Here's a sample Excel spreadsheet of findings, using the method shown above:
| View file | ||||
|---|---|---|---|---|
|
Note that we’ve used a spreadsheet here, but we’ve also done this matrix using a whiteboard, adding each finding as a color-coded sticky note (where green is good, pink is bad, and yellow is neutral).
You We may find the whiteboard method better for on-site collaboration with your our team, whereas the spreadsheet may work better for remote collaboration (assuming you’re we’re using an online spreadsheet like Google Sheets or Office 365) or for cases where the results need to be portable and easily accessed later in the project.
...
Another simple way of recording findings is to add a “Findings” column to the spreadsheet where we created our tree(s).:
...
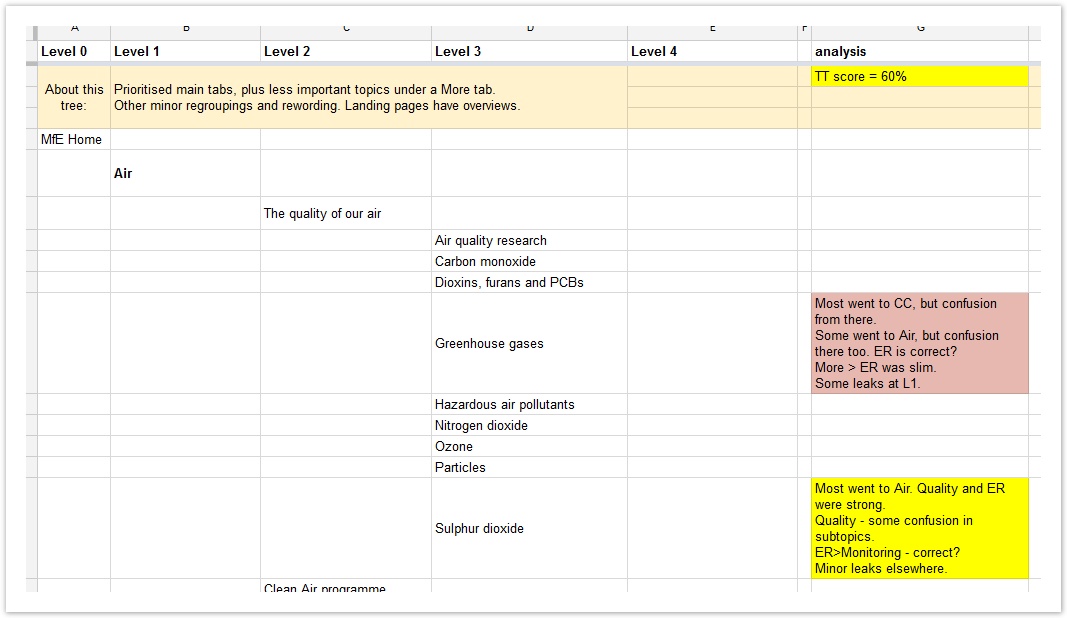
This works well when the findings map directly to specific items in our trees. For findings that need action (see below), you we may want to highlight these according (e.g. red cell background).
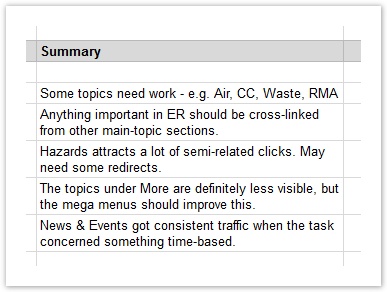
For more general findings, you may want to create an area at the bottom of the spreadsheet to document these:
- ss
The benefit of this method is context – when you we come back to revise this tree (or extract the best ideas from it for a new tree), you’ll we’ll see the specific items that performed well or poorly.
The main drawback of this method is the same for hardcopy markup above – it makes it a bit harder to see the big picture across tasks and across different trees.
Finally, for more general findings, we may want to create an area at the bottom of the spreadsheet to document these:
...
Next: Turning findings into actions
...