Just as we saw for the study's overall score, the most important thing to look at for a task is success rate – how many participants found the correct answer?
This is typically rated out of 10 or 100. For example, a score of 71 means that 71% of the time, participants arrived at a correct answer:
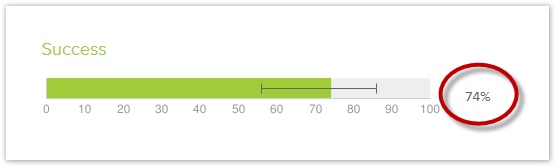
The same rough markers we used for overall scores hold true for individual tasks:
| Success score | Meaning |
|---|---|
| 0-50 | Most participants had real trouble with the task. If they understood the task properly, then the tree failed to do its job. If they didn’t understand the task (see ~Where people went below), then you won’t be able to judge the tree based on this task alone. |
| 50-65 | A mixed bag: most found it, but quite a few didn’t. This usually indicates that the tree is roughly right for this task, but there are specific topics that are luring some users off the correct paths. |
| 65+ | Most participants succeeded. Your tree is performing well for this task, and probably only needs minor tweaks to corral the wayward few. |
Success rate is a good general indicator of the effectiveness of our tree, but immediately we want to dig deeper. For example, if we have a success rate of 27% on a task, we naturally want to ask “Where are all these people going wrong?”. For that, we need to look at the paths they took through our tree.
Next: Where they went